Dynamics of Global Vegetation Leaf Area Index(LAI)from 1982 to 2011
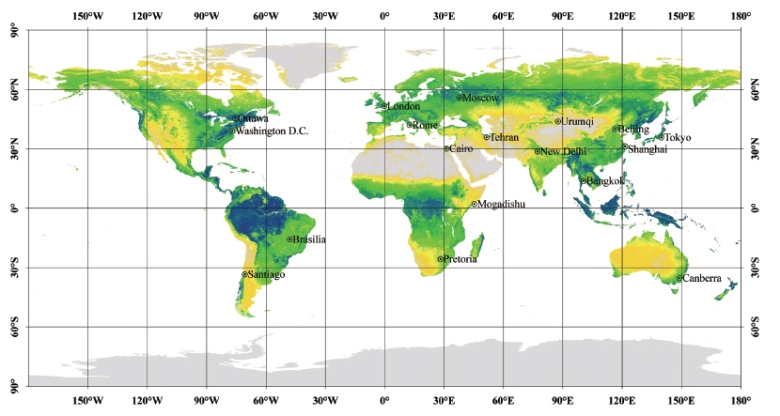
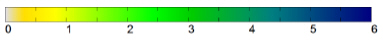
Global Thirty Years Average Maximum LAI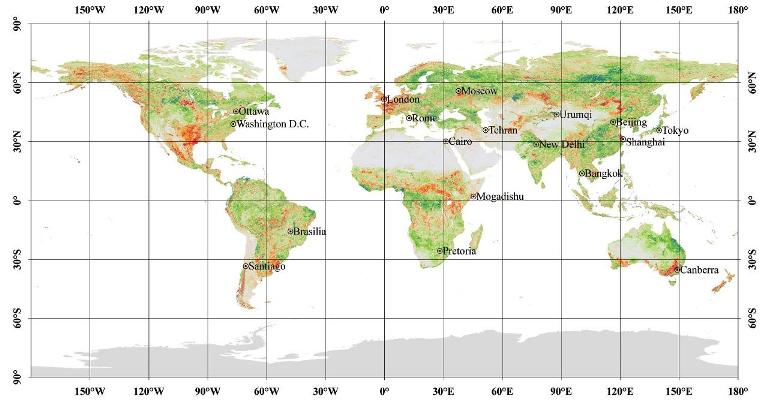

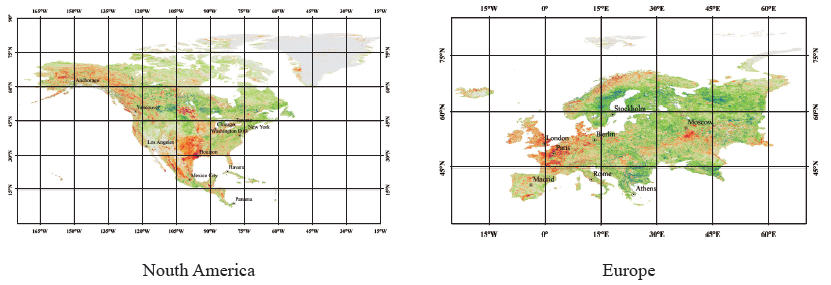
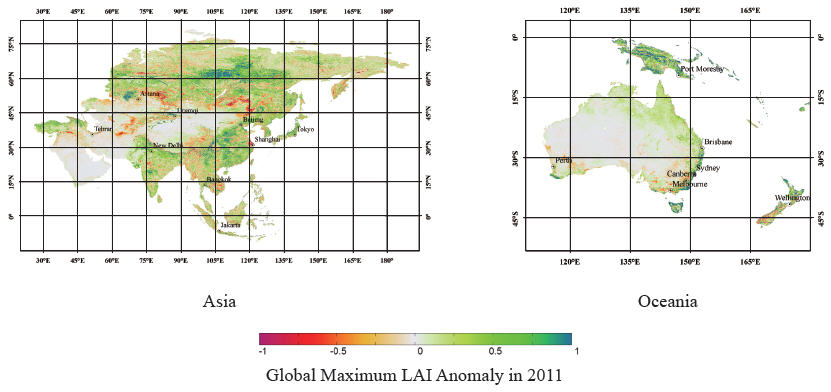
Global Maximum LAI Anomaly in 2011
1 Development of Global LAI Products
Vegetation Leaf Area Index (LAI) is defined as the one-sided green leaf area per unit of
vegetated ground area in broadleaf canopies and as one-half the total needle surface area per unit of
vegetated ground area in coniferous canopies. It is one of the essential parameters for global land
ecosystem assessment and environmental change modeling.
The global LAI datasets are that of 8-day composites from 1982 to 2011 (46 datasets each year
in 30 years), including Maximum LAI (MLAI), Minimum LAI (Min LAI) and Yearly Average LAI
(ALAI), in which the datasets from 1982 to 1999 are based on NOAA-AVHRR with 5 km spatial
resolution; the datasets from 2000 to 2011 are based on Terra/Aqua-MODIS with 1 km spatial
resolution. In addition, using compatible methods, the global LAI dataset 2011 was also integrated
with FY-3-MERSI with 1 km×1 km per pixel. The world administrative boundary data is provided by
the National Geomatics Center of China (NGCC).
2 Analysis of Global LAI Dynamics from 1982 to 2011
Based on the Yearly Average LAI (ALAI), Minimum LAI (Min LAI), Maximum LAI (MLAI)
from 1982 through 2011, the Average of ALAI, Min LAI and MLAI during the last 30 years are
calculated. The Average ALAI (1982-2011) is 1.05, Average Min LAI (1982-2011) is 0.54, and
Average MLAI (1982-2011) is 1.88. The Yearly LAI Values of the World from 1982 to 2011 are listed
in Table 1.
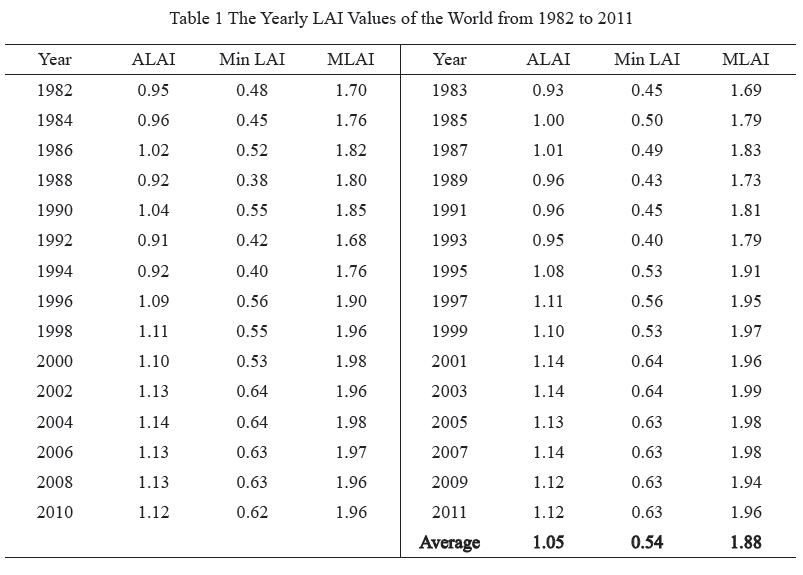
In order to analyze the yearly changes during the last 30 years, the term of vegetation LAI
anomaly is used, which means a departure of yearly value from that of 30 years average.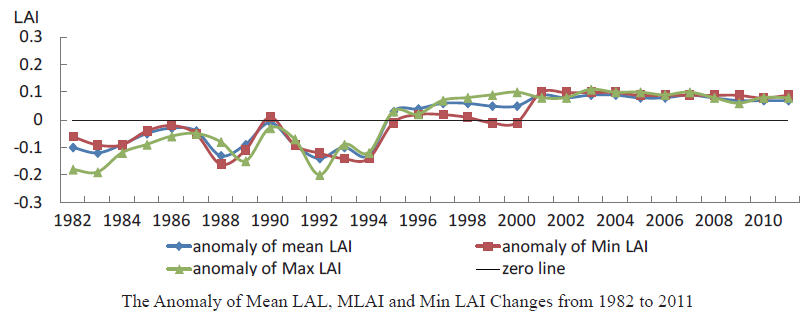
The similar trend of the three parameters of LAI, including anomaly of Mean LAI, MLAI and
Min LAI, can be found. Furthermore, the anomaly of the three parameters are all positive after 1995;
an increase of LAI from 1995 to 2001 is particularly evident, and remains stable with little increase
from 2001 to 2011, the anomaly values reach 0.06-0.10. Thoughtful the climate change, the United
Nations Conference on Environment and Development (1992) and the following up policies and
actions on environment in both international and national levels could contribute to the trends.
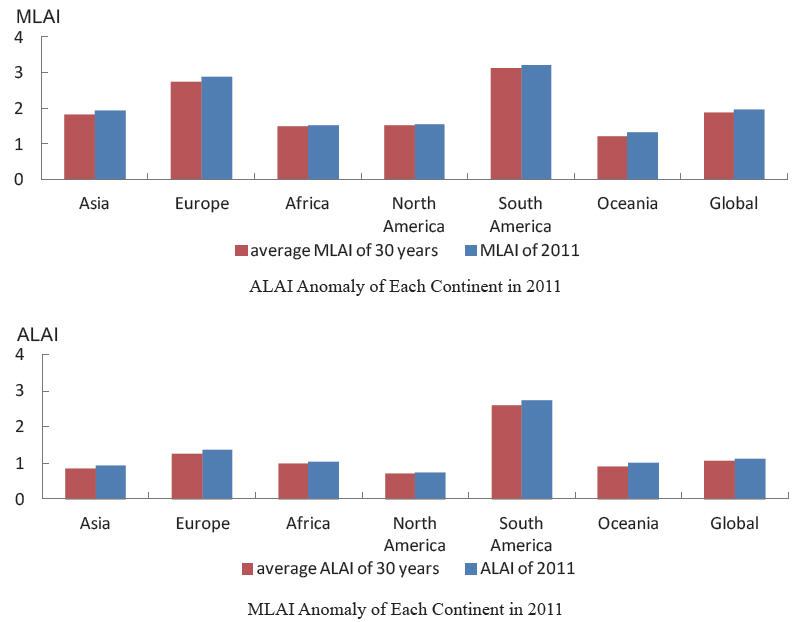
3 LAI in Each Continent in 2011
Based on statistics of the LAI in 2011, the global ALAI in that year is 1.12, which is higher
0.07 than that of the 30 years’average; and the MLAI is 1.96, higher 0.08 than that of the 30 years’
average. However, the increased values are different in different continents. For example, the most
increased continent of ALAI is South American, increasing 0.15, and the most increased continent of
MLAI is Europe, where it goes to 0.16.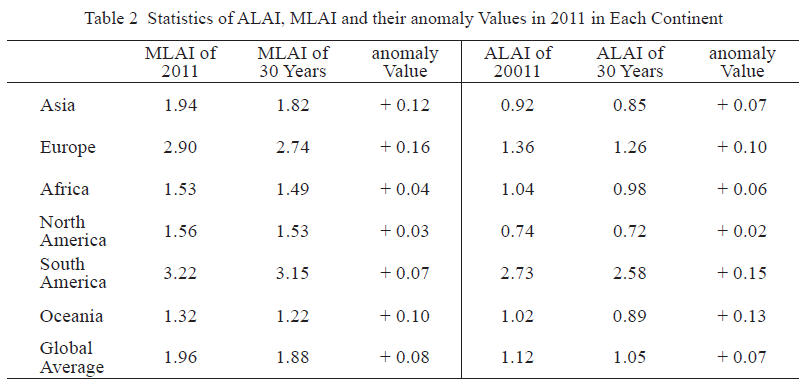
The global LAI change pattern in 2011 is uneven. For example, the Maximum LAI Anomaly
in 2011 is much higher in the belt from 50°N to 70°N from Europe to Asia and to North America, it
goes 0.25(ALAI)and 0.50(MLAI). Similar changes of LAI in 2011 are clearly observed in eastern
China, Guinea Bay and the Congo basin in Africa, the northern Amazon region, and northeast of
Australia.
However, the Maximum LAI Anomaly in 2011 in some regions of the world is lower, it even
goes to -0.25(ALAI)and -0.50(MLAI) These regions include western Europe, southern of North
America, northeast of the Mongolia Plateau, south of the Amazon and southeast of South America,
around area of the Congo basin in Africa, and southeast of Australia. The reasons for making these
changes are complex, climate of the year could be one reason (for example in Europe), extensive fire
could be another (for example in Australia), and intensive human activities could be major reason
(for example in southern surrounding area of the Amazon basin , and surrounding area of the Congo
basin).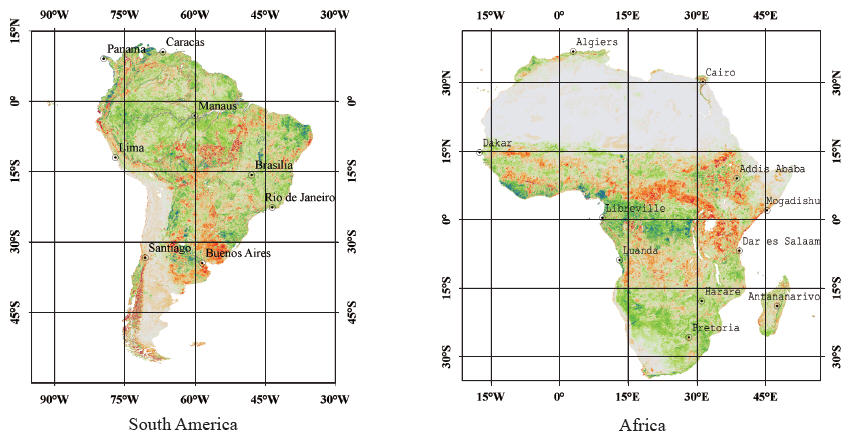
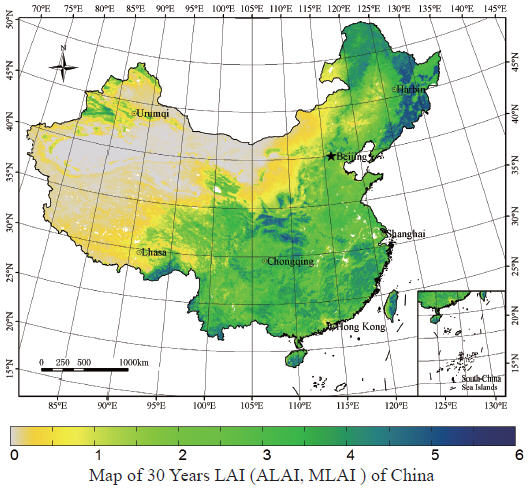
4 LAI Change of China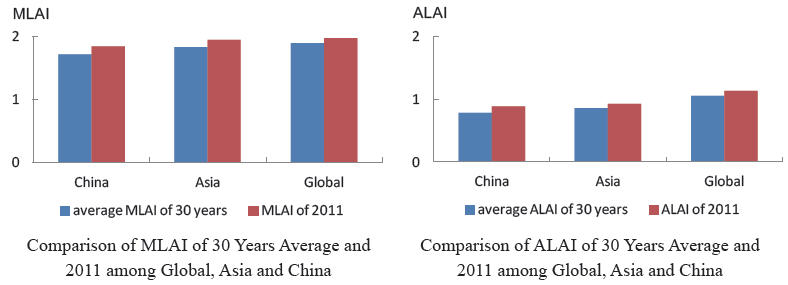
The statistics of LAI of China indicate that either the LAI of China in 30 years average and in
2011 is lower than that of the global average and Asia. The 30 years average ALAI of China is 0.77,
which is less 0.28 than the global average. In 2011, the ALAI of China is growing to 0.88, which is
still less 0.24 than the global average, and 0.04 less than that of Asia. Because of the geographical
location and vegetation types, the distance of 30 years average MLAI between China and the global
average is less than ALAI, which is 0.18, the distance of MLAI 2011 between China and the global
average is 0.13.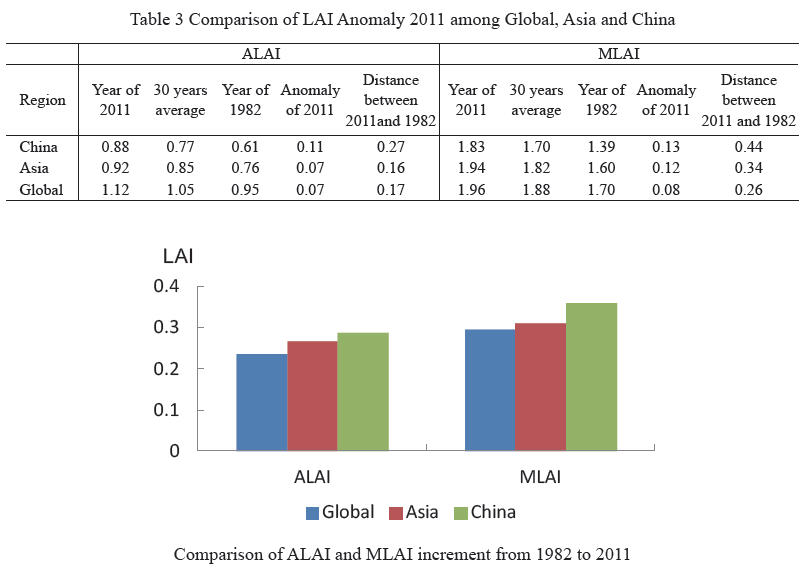
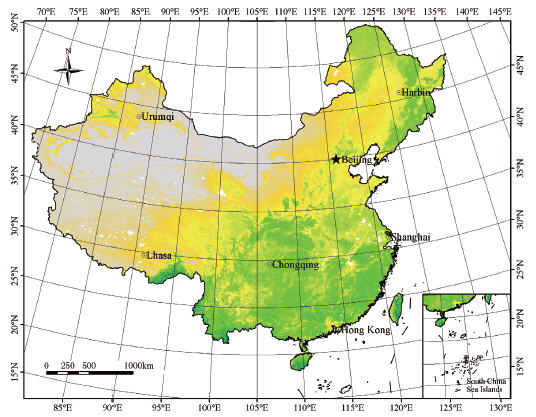
Compatible with the precipitation contours of 400 mm/year in China, which is specifically
affected by climate and terrain, China is divided into two sections– eastern and western. The LAI of
eastern China is much higher than that of western China, and the LAI is decreased from southeast to
northwest gradually.
The highest 30 years ALAI is 4.72, in Wuzhi Mountain of Hainan province. Other regions
with higher 30 years ALAI include eastern Tibet, south of Yunnan Province, and eastern Taiwan
Island. The highest 30 Years MLAI is 5.35, located in Changbai Mountain, northeast of China. The
Xing’anling Mountains, Qingling Mountains, Hills of Eastern China, Mountains in Hainan and
Taiwan islands also exhibit a higher MLAI.
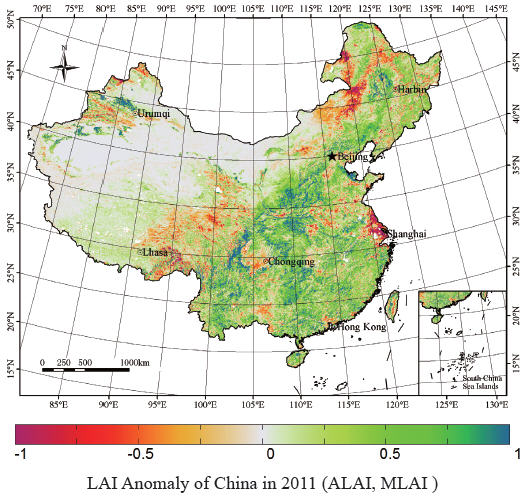
In 2011, ALAI anomaly increased in most provinces of China. The provinces and regions with
ALAI anomaly above 0.40 include Hong Kong (0.65), Hainan (0.59), Chongqing (0.48), Hunan (0.47),
Jiangxi (0.47), Guangxi (0.44), Fujian (0.4) and Taiwan (0.42). The decreased areas include Shanghai
(-0.30), Jiangsu (-0.02), eastern Mongolia, east of Qinghai-Tibet Plateau, as well as Tianshan and the
Artai Mountains in western China.
京备ICP05006171号-2 Copyright@2000-2011 nrscc.gov.cn All Right Reserved