Global Land Surface Water 2010 and
Dynamic Changes of Sample Lakes 2001-2011
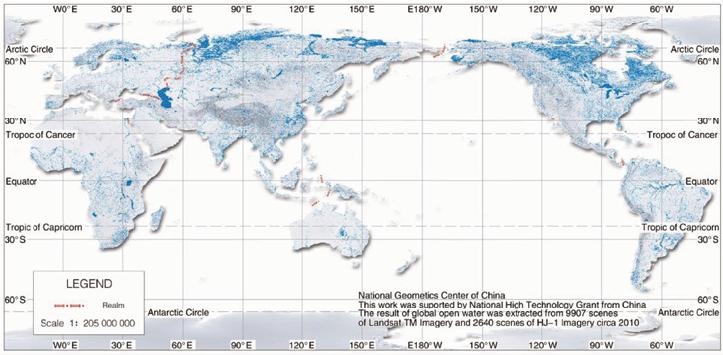
Global Land Surface Water Map 2010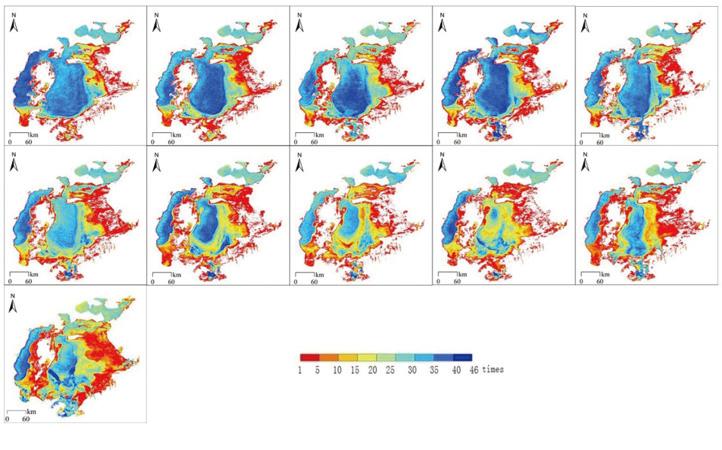
Area Changes of Aral Sea from 2001 to 2011
1 Datasets on Global Land Surface Water 2010 and Dynamic
Changes of Sample Lakes in 2001-2011
Land Surface Water is a major component of global water circulation, and one of the most important
parameters describing Earth ecosystem. Its fluctuation and dynamic changes indicate the influence of climate
change, land-surface process and human activities on the water circulation, material migration and ecosystems.
In this report, the words "Land Surface Water (LSW)" stands for all open water bodies on the land surface,
such as rivers, lakes, reservoirs and so on.
The datasets are in two parts. The first dataset is Global Land Surface Water in 2010 with pixel resolution
of 30-meter, including the area of Land Surface Water and the Rate of LSW area to the total area of the region
under consideration. The second is on dynamic changes of open water inundated area of 7 sample lakes, with
an interval of 8 days in the period of 2001-2011 with pixel resolution of 500-meter. The datasets are derived
from integrated use of satellite data from Landsat-TM and ETM+, HJ-CCD, Terra/Aqua-MODIS and FY3-
MERSI.
2 Analysis of Global Land Surface Water 2010
2.1 Spatial Distribution of Land Surface Water in the World
For analysis purpose, three indicators are used: the total Area of Land Surface Water (Area-LSW, km2),
the Rate of LSW area of a region to that of the World (WR-LSW, %), and the Rate of LSW area of a region to
the total area of the region (Water Rate, %).
Based on statistics from the Global Datasets of Land Surface Water 2010, the total area of global Land
Surface Water is 3,676,700 km2, which is 2.73% of global land surface area. North America is the highest
continent in LSW, with total LSW area of 1,530,200 km2, occupying 6.28% of its land surface area and 41.62%
of global LSW area. Oceania is the lowest with a total LSW area of 48,200 km2, occupying 0.57% of its land
surface area and 1.31% of global LSW area. The statistical result of each continent is listed at the Table 1.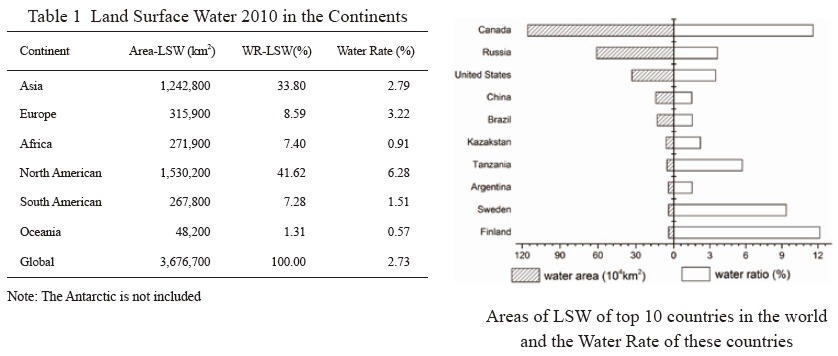
The top ten countries rich in LSW are: Canada, Russia, United States, China, Brazil, Kazakhstan,
Tanzania, Argentina, Sweden and Finland.
Table 1 Land Surface Water 2010 in the Continents
2.2 Areas of Land Surface Water in Each Continent
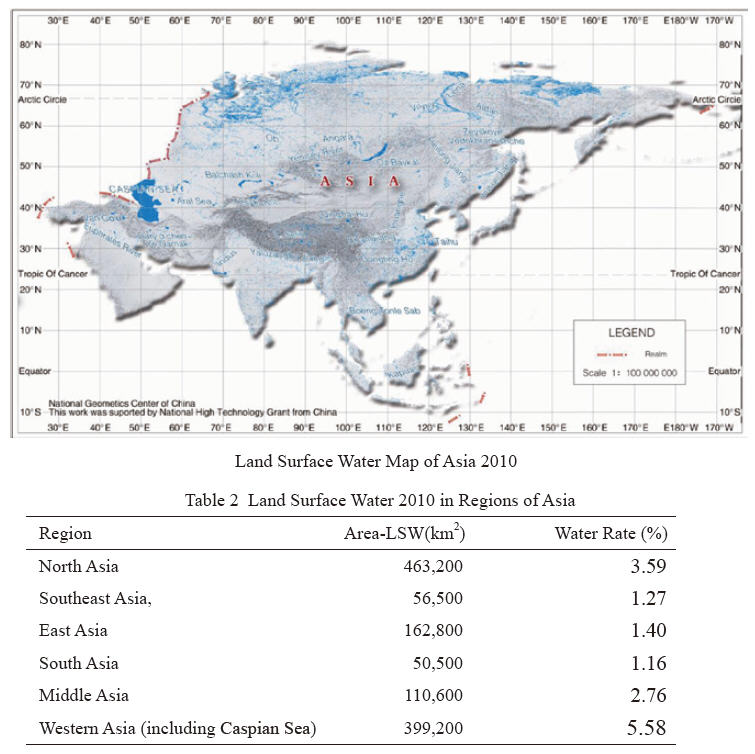
The total area of LSW of Asia is 1,242,800 km2, occupying 33.80% of world LSW area and
only lower than that of North America. The top ten countries of LSW in Asia are: China, Kazakhstan,
India, Turkmenistan, Indonesia, Iran, Uzbekistan, Mongolia, Turkey and Thailand1. The areas of
Land Surface Water and Water Rate in North Asia, Southeast Asia, East Asia, South Asia, Middle
Asia and Western Asia are listed in Table 2.
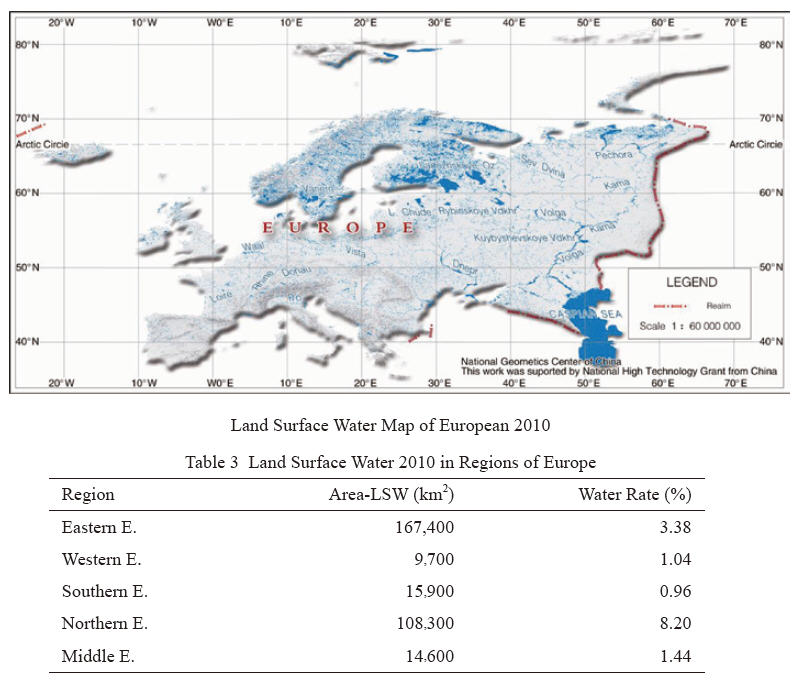
The total LSW area of Europe is 315,900 km2, which is 8.59% of the world. The Water Rate
in Europe is 3.22%, which is above of the world average. The top ten LSW countries in Europe are:
Russia (including its Asian part), Sweden, Finland, Norway, Ukraine, Poland, France, Germany,
Spain and Romania. Finland is the top country in Water Rate, up to 12.16%. The LSW areas and
Water Rates of Eastern Europe, Western Europe, Southern Europe, Northern Europe, and Middle
Europe are listed in the Table 3.
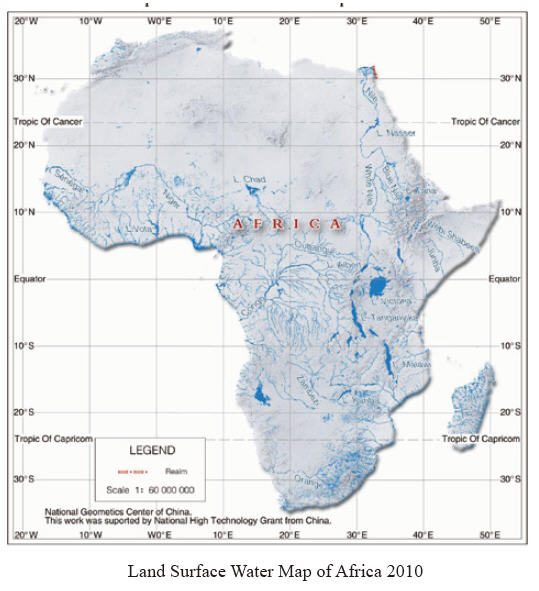
The total LSW area of Africa is 271,900 km2, which is 7.40% of the world. Its Water Rate is
0.91%, lower than the average of the world. The top ten LSW countries in Africa are: Tanzania, the
Democratic Republic of Congo, Uganda, Malawi, Zambia, Kenya, Mozambique, Nigeria, Ghana
and Ethiopia. The LSW areas and Water Rates in Eastern Africa, Western Africa, Southern Africa,
Northern Africa and Middle Africa are listed in Table 4.
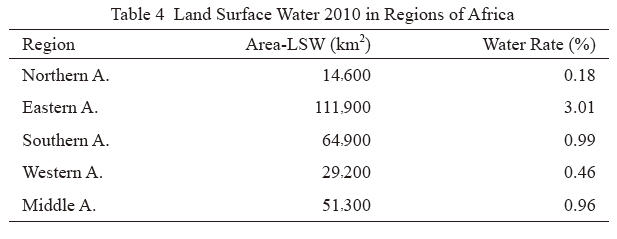
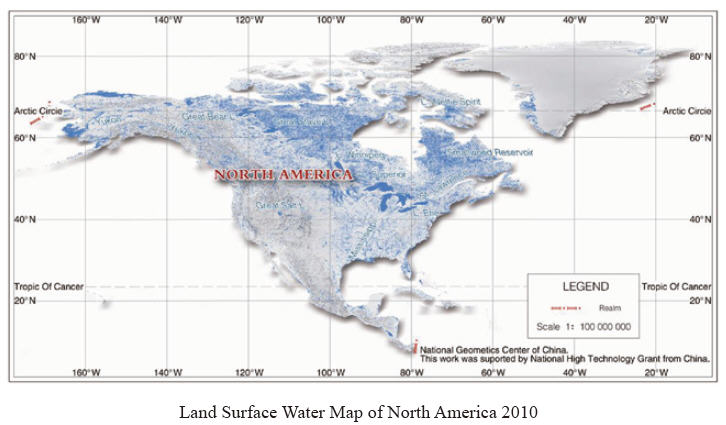
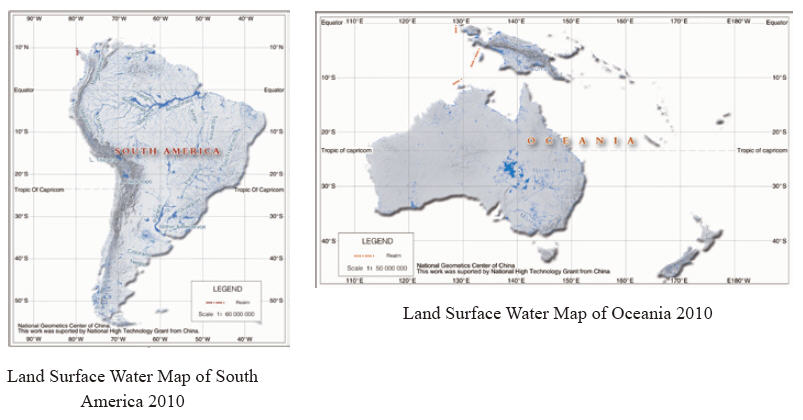
The area of LSW of North America is 1,530,200 km2, which is 41.62% of the total area of
global LSW, and its Water Rate reaches to 6.28%, the highest in the world. The LSW area of South
America is 267,800 km2, 7.28% of the total area of global LSW, and has a Water Rate of 1.51%, less
than the average of the world. The LSW area of Oceania is 48,200 km2, with a Water Rate of 0.57%,
which is the lowest in all of the continents.
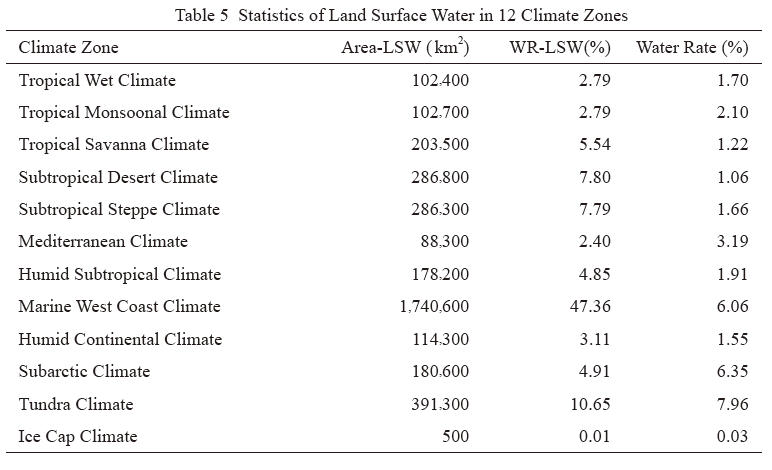
2.3 Land Surface Water in Climate Zones
According to the Köppen-Geiger's Climate Classification System, LSW areas in 12 climate
zones were calculated. The most rich LSW zone is the Marine West Coast Climate Zone, which
covers 1,740,600 km2 of Land Surface Water, occupying 47.36 % of global LSW.
The Area of Land Surface Water (Area-LSW), Rates of LSW area of a region to that of the
World (WR-LSW, %), and the Water Rate (%) in each climate zone are listed in Table 5.
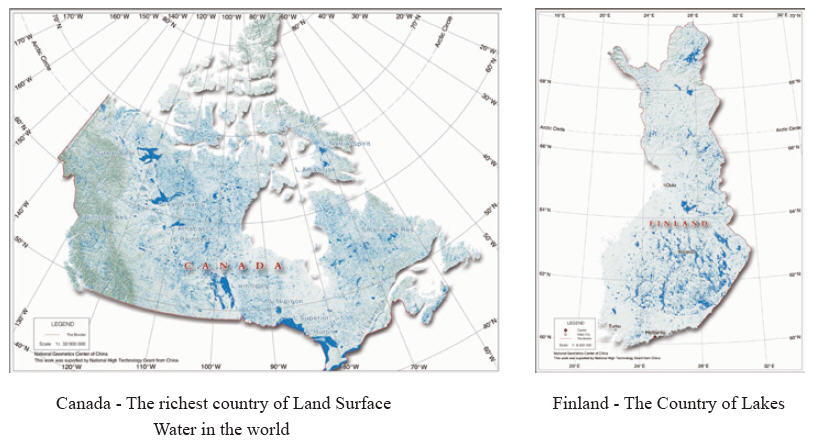
2.4 Sample Spatial Patterns of Land Surface Water
The patterns of Land Surface Water distributed on the Earth are diverse. Several samples are
given in the report. Canada is the richest country of LSW in the world, having a LSW area of 1,160,000
km2 and a Water Rate of 11.6%. Finland, the Country of Lakes, hosts more than 188,000 lakes, which
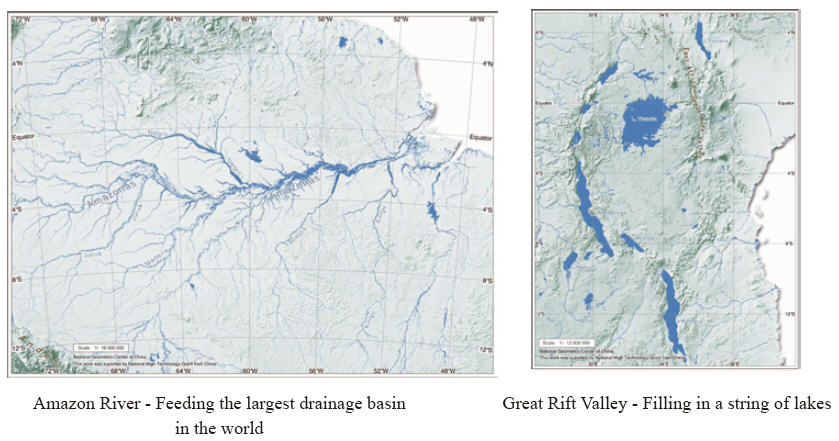
is about 12.2% of the country’s total area. The Great Rift Valley, filling in a string of more than 30
lakes, is a habitat of great biodiversity. The Amazon River, feeding the largest drainage basin in
the world (about 7,050,000 km2), originates from the Andes in Peru and drains across Brazil to the
Atlantic. It is also an area with highly biodiversity, from which, Brazil, Peru, Colombia, Bolivia,
Venezuela and Ecuador are benefited.
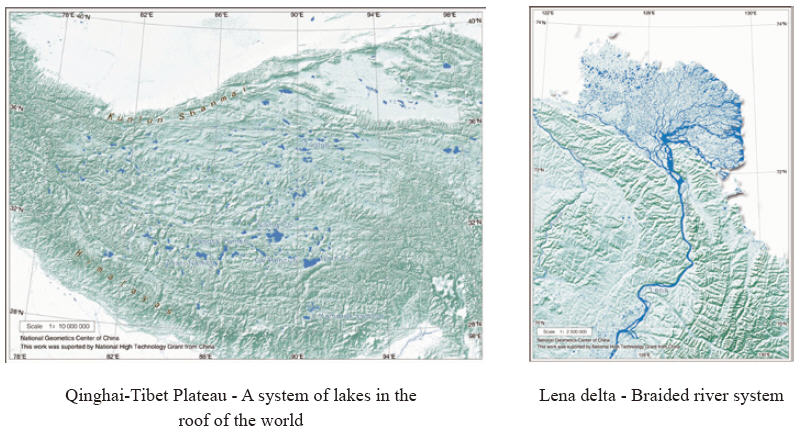
The Qinghai-Tibet Plateau, a system of lakes at the roof of the world, contains 608 billion m3 of
LSW, equivalent to more than 70% of that of China. The Lena delta is a braided river system, covering
an area of 32,000 km2, with more than 1000 islands separated by more than 150 braided branches and
ravine streams.
3 Seasonal Change of Sample Lakes in 2001-2011
To analyze the changes of global lakes, 7 lakes were selected as examples, namely Poyang Lake
(Asia), Aral Sea (Asia), Lake Victoria (Africa), Great Lakes (North America), Lake Vaner (Europe),
Lake Titicaca (South America) and Lake Eyre (Oceania). Based on the dataset compositely derived
from Terra/Aqua and FY-3 satellites with 8 days temporal interval (46 times each year), the dynamic
changes of the lake areas were calculated from 2001 to 2011. The minimun 1 represents the areas
that covered by water only for 1 x 8 days in a year, and the maximum 46 means that the areas were
covered by water over the whole year.
Poyang Lake is the largest freshwater lake of China, connecting the Yangtze River, the largest
river of the country. Affected by monsoon climate and intensive human activities, dynamic change
in its area is remarkable both seasonally and annually. During the period from 2001 to 2011, its
maximum area was 3,874 km2 and the minimum was only 721 km2. The difference of water areas of
the lake between rainy season (June-August) and dry season (November-February) was as high as
about 2,700-3,200 km2.
Lake Victoria is the largest lake in Africa and one of the largest tropical lakes in the world. It
has low seasonal variability in water area. During 2001-2011, its maximum area in wet season was
83,800 km2, and the minimum in dry season was 60,300 km2.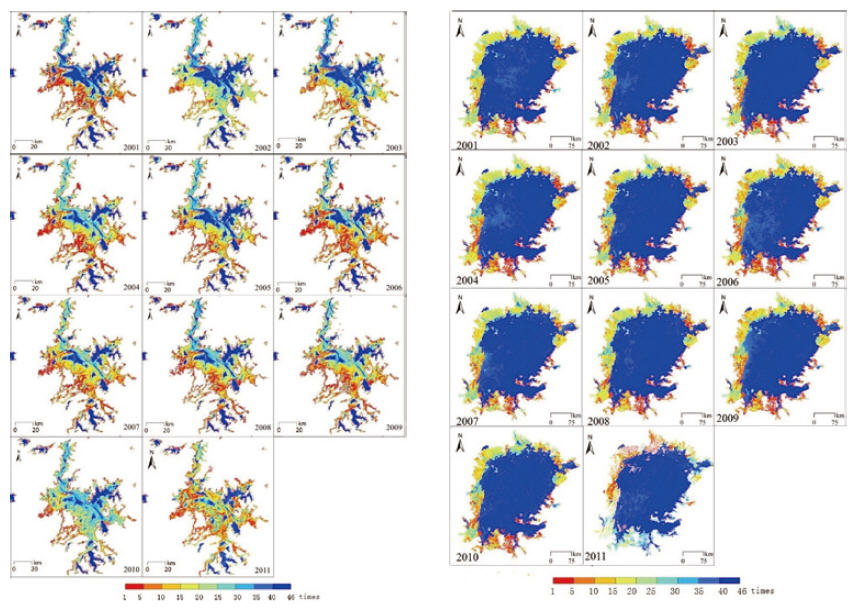
京备ICP05006171号-2 Copyright@2000-2011 nrscc.gov.cn All Right Reserved